What Is Microfluidic Vortex Shedding?
By Fong L. Pan, B.Sci M.Sci
Microfluidic vortex shedding (µVS) has been shown to enable the efficient delivery of various constructs like mRNA, plasmid DNA, and Cas9 RNPs (CRISPR) to primary human T cells [1]. But what is µVS? And, how does µVS enable intracellular delivery of constructs to primary cells like activated T cells?
In this blog post, we provide some background on vortex shedding and use single-phase simulation to explain what happens to cellVortex shedding and the related Kármán vortex street are not novel. These phenomena can be found in rivers or streams flowing past boulders and even in the clouds moving past mountains or islands. Vortex shedding has also been used to precisely mix fluids on the microscale [2].

Plots of the cytokine profiles for µVS relative to handling, media, and activation controls
What Is Vortex Shedding?
Vortex shedding occurs in the near wake of a bluff body due to instability created at the right flow conditions. Put simply, if you flow a fluid like air or water past a bluff body such as a post, boulder, or mountain at the right conditions, you create fluctuating flow fields along with drag and lift forces acting on the bluff body. This results in vortex shedding where a Kármán vortex street can frequently be observed.
For a cylindrical post, the onset of vortex shedding occurs at an object Reynolds number of about 40 (Reo > 40)4. These vortex shedding patterns become more complicated with an increasing object Reynolds number or with increasing numbers of bluff bodies and their proximity.
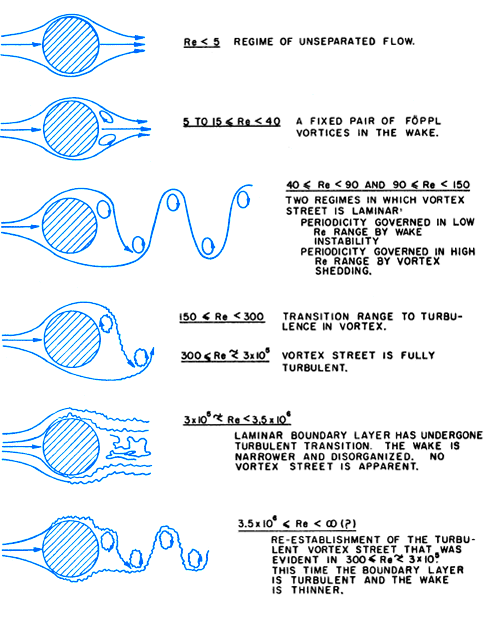
Overview of different vortex shedding regimes
What Is a Reynolds Number?
In fluid dynamics, the Reynolds number is the non-dimensional ratio of inertial to viscous forces. This means vortex shedding typically occurs when the inertial forces of a fluid flow around a bluff body are at least 40 times greater than the viscous forces acting on the fluid. For Re_o > 40, we should see downstream flow instability and resultant vortices. Herein, the Reynold number for flow past a bluff body is denoted as the object Reynolds number (Re_o).
For the team at Indee Labs, understanding the intricacies of vortex shedding is essential. This knowledge allows us to engineer vortex shedding such that our µVS devices and protocols result in optimal yield or the percentage of recovered, viable, and modified T-cells.
In More Detail
A numerical study of detailed wake patterns of laminar flow past a microarray platform is briefly presented here. This simulation uses our standard µVS device geometry for activated T-cells. This array consists of 16 circular cylinders in side-by-side arrangements with a total of 6 columns in parallel positions, as shown below. The flow condition is considered laminar due to the low flow cell (Refc), channel (Rec), and gap (Reg) Reynolds numbers.
Not all Reynolds numbers are alike; there are different Reynolds numbers for the flow cell, individual channels, gap, and posts. Under typical µVS processing conditions for activated T cells, we see Reynolds numbers according to the table below.
Reynolds Number Value
Flow cell, Re_fc 271
Channel, Re_c 180
Gap, Re_g 291
Object, Re_o 146
Flow in the device flow cell and channels is definitively laminar. When considering flow through a flow cell and channels, laminar flow occurs between 1 < Re < 2,100 [4]. Thus, we know the vortices shown in the simulation below likely result from vortex shedding since the object Reynolds numbers are estimated to be 146 or much greater than 40 while all other Reynolds numbers are much less than 2,100.

Contour plot of instantaneous velocity for a transient simulated flow field (units are in m s-1).
In Summary
The gist of it is vortex shedding has been well-studied for a while [3]. However, the team at Indee Labs is the first to apply microfluidic vortex shedding (µVS) to gene delivery and has received many granted patents.
During µVS, cells are mixed in suspension with the desired construct and then exposed to hydrodynamic conditions or fluid forces sufficient to temporarily porate the cell membrane -- this allows for constructs like Cas9 ribonucleoproteins (Cas9-RNPs) to enter the cell cytoplasm. Our current µVS prototypes can quickly process tens of millions of cells while preserving native cell states1.
This is measured by T-cell activation, exhaustion, cytokine profiling, and transcriptome-wide sequencing. Serendipitously, these are the ideal characteristics of an intracellular delivery technology for gene-modified cell therapies like chimeric antigen receptor T cells or CAR-T.
Sangmo’s Findings
Vortex shedding due to flow past a single bluff body is one thing. Vortex shedding as a result of flow through a post array is an additional field of research. We are not the first to study flow over multiple cylinders, and a lot of the prior work has been focused on dual cylinders due to simple configuration [5-7].
Others have studied the effects of vortex shedding on more complex post arrays. However, this minimizes vortices for high-fidelity cell separation and is the opposite of our intent [8]. Select prior work concluded that flow could be summarized into two major regimes with a complex transition region between the two [9-12].
The flow is periodic for two cylindrical posts nearby, and the wake is a single Kármán vortex street as if the flow passed a single bluff body. Coupled and synchronized vortex streets in the wake have been observed when the same two cylinders are further. Lastly, intermediate spacing leads to complex transitional patterns, such as bi-stable biased gap flow, as observed by Kim and Durbin [13].

Plots of instantaneous vorticity contours (left) and streamlines (right) for these wake patterns: (a) unsteady antiphase-synchronized, (b) unsteady in-phase-synchronized, (c) unsteady flip-flopping, (d) steady single bluff-body, (e) steady deflected and (f) steady pattern [14].
Sangmo has performed two-dimensional numerical studies on various dual cylinder arrangements at a range of low Reynolds number 40 < Re_o < 160 and a gap ratio (gap width/cylinder diameter) of less than 5 [14]. Sangmo’s numerical results identified six kinds of wake patterns in the flow field. These wake patterns are named and categorized as the following; more detail on these patterns can be found in his paper:
Unsteady anti-phased synchronized pattern
Unsteady in-phased synchronized pattern
Unsteady flip-flopping pattern
Steady single bluff-body pattern
Steady deflected pattern
Steady pattern
Typically, the flow characteristics significantly depend on the object Reynolds number and relative gap spacing [14].
What Does This Have to Do with Intracellular or Gene Delivery?
Well, at Indee Labs, we need to fine-tune each µVS device geometry to create the optimal vortex shedding for intracellular delivery. We examined what happens in our standard µVS device when a single-phase flow is simulated at standard conditions.

Contour plot and graph of pressure in a µVS device under typical processing conditions.
As you can see above, suspended cells flow through the post array and are pulsed with an approximately 1.4 ATM (20 psig) pressure drop followed by a 0.4 ATM (6 psig) pressure increase. If we use the simulation results to estimate flow speeds for approximate time scales, the pressure drop occurs over about two µs, and the pressure increase occurs over about 40 µs.
Between post arrays, the cells and surrounding constructs are subject to a high degree of vorticity or ‘mixing.’ This is thought to enhance cell-construct interactions while the cell membrane remains permeable.
Cumulatively, intracellular delivery is likely caused by the superposition or combination of pressure changes and vorticity or ‘mixing.’ More specifically, the combination of these hydrodynamic fluid forces sufficiently permeabilizes the cell membrane to allow various constructs to enter the cell before modifying or engineering each cell.
Future Work
Single-phase simulation is a great starting point. However, all simulations need to be verified experimentally. Plus, these single-phase simulations assume suspended cells have a negligible effect on fluid dynamics. Developing and verifying more accurate simulations will be no easy feat. This will require imaging objects with a diameter of 1/10 to 1/100 the thickness of a human hair while traveling at speeds as high as 20 m s-1 (45 mph).
We are working on a multi-phase computational model to expedite µVS device development for T cells and other cell types. Verifying that model will involve imaging cell and particle trajectories at frame rates exceeding 500,000 frames per second.
Technical jargon aside, success with that project will allow us to more readily develop chips for alternative cell types and different processing media. This will accelerate development timelines as we move outside of just primary human T-cells.
References
Jarrell, Justin A., et al. "Intracellular delivery of mRNA to human primary T cells with microfluidic vortex shedding." Scientific reports 9.1 (2019): 3214.
Renfer, Adrian, et al. "Vortex shedding from confined micropin arrays." Microfluidics and nanofluidics 15.2 (2013): 231-242.
Bearman, Peter W. "Vortex shedding from oscillating bluff bodies." Annual review of fluid mechanics 16.1 (1984): 195-222.
Gerhart, Philip M., Andrew L. Gerhart, and John I. Hochstein. Munson, Young and Okiishi's Fundamentals of Fluid Mechanics, Binder Ready Version. John Wiley & Sons, 2016
Deng Jian, Ren An-lu, and Zou Jian-Feng, “Three-dimensional flow around two tandem circular cylinders with various spacing at Re=220”, Journal of Hydrodynamics, Ser. B, 2006, 18(1): 48-54.
Sun Ren, Chwang Allen T., “Interaction of a floating elliptic cylinder with a vibrating circular cylinder”, Journal of Hydrodynamics, Ser. B, 2006, 18(4): 481-491.
Sumner D., Wong S. S., and Price S. J. et al, “Fluid behavior of side-by-side circular cylinders in steady cross-flow”, Journal of Fluids and Structures, 1999, 13(3): 309-338.
Dincau, Brian M., et al. "Deterministic lateral displacement (DLD) in the high Reynolds number regime: high-throughput and dynamic separation characteristics." Microfluidics and Nanofluidics 22.6 (2018): 59.
Bearman P. W., Wadcock A. J., “The interaction between a pair of circular cylinders normal to a stream”, Journal of Fluid Mechanics, 1973, 61: 499-511.
Kiya M., Arie M., and Tamura H. et al, “Vortex shedding from two circular cylinders in staggered arrangements”, ASME Journal of Fluids Engineering, 1980, 102(2): 166-173.
Zdravkovich M. M. “Flow induced oscillations of two interfering circular cylinders”, Journal of Sound and Vibration, 1985, 101(4): 511-521.
Williamson C. H. K., “Evolution of a single wake behind a pair of bluff bodies”, Journal of Fluid Mechanics, 1985, 159: 1-18.
Kim H. J., Durbin P. A., “Investigation of the flow between a pair of circular cylinders in the flopping regime”, Journal of Fluid Mechanics, 1988, 196: 431-448.
Sangmo K., “Characteristics of flow over two circular cylinders in a side-by-side arrangement at low Reynolds number”, Physics of Fluids 15, 2486 (2003).